
Using Neurological Reset Systems to Decrease Force Asymmetries in Linear Sprinting
One of the most impactful experiences in my career so far was interning at the University of Minnesota with Cal Dietz and the Triphasic Training crew in the fall and winter of 2024. When I first stepped into the University of Minnesota weight room at Mariucci Arena, I was awestruck by the sheer amount of equipment and technology available to the athletes and coaches. GymAware VBT systems, 1080 Sprints and Quantums, MuscleLab timing gates and force plates, it was a sports scientist’s paradise.
I had the fantastic pleasure of monitoring high level hockey athletes while they worked out and my favorite thing of all was sitting behind the 1080 Sprint to watch the athletes run. I’m very fortunate to have teamed up with IHT Human Performance in 2025 where I got to use the 1080 Sprint 2 with athletes. I’ve always been mesmerized by sprinting. It is one of the most fundamental and deeply ingrained patterns that we possess as humans.
What I’m going to talk about today is what I’ve learned about the 1080 Sprint when it comes to asymmetries in sprinting and certain interventions we can use in training to reduce them. This article will be useful for any sport, strength or speed coach, physical therapist, athletic trainer, sports scientist, or other staff members responsible for an athlete's success.
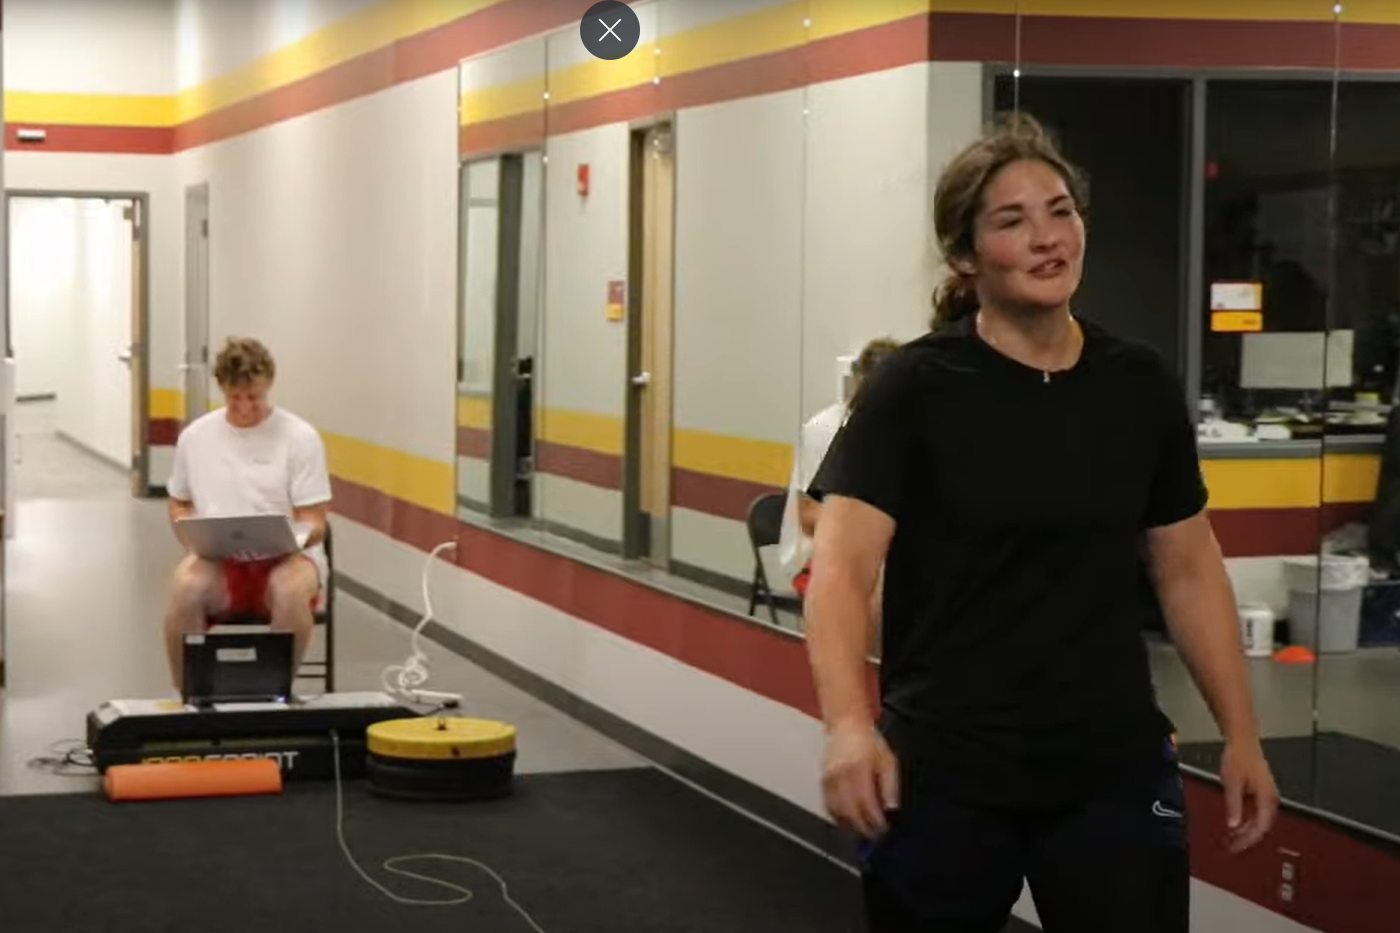
“Coach Jungels observing an all time PR on assisted sprinting by PWHL Frost goalie Nicole Hensley at the University of Minnesota.”
The 1080 Sprint can show you a lot of things. One thing that the 1080 Sprint can show you is FORCE and TIME/POSITION of an athlete on their left and right leg when they are sprinting. Along with average peak force on each leg, it can also show you step length and step frequency. These give coaches valuable insights when it comes to monitoring them on a long-term basis to know if any intervention may be necessary to prevent injury caused by too much reliance on one limb versus another.
That last sentence may give some of you out there a knee jerk reaction. I will admit that for many athletes, asymmetry is normal! Is pitching an asymmetrical activity? How about jumping or throwing events in track and field? The answer is yes. There is a valid argument to be made that these things might not matter much in certain populations and any intervention designed to reduce them might actually result in a DECREASE in their performance. Their body is attempting to use a strategy to compete at a high level. Usian Bolt was suspected of having a 13% difference in force production between his left and right legs when sprinting. To my knowledge, Bolt was never hooked up to a 1080 and this asymmetry was calculated using predictive models created with research done by Clark, Ryan, and Weyand. Am I going to sit here and try to claim that reducing this would’ve increased performance? The answer is absolutely not.
We should save our arguments for cases where there is a stark difference between limbs, possibly due to prior injury/current neural compensation, and those differences do not switch from one side to the other over a period of time. I believe as a coach, if you have the privilege of testing and monitoring your athletes, whether it be on a force plate or a 1080, you need to find ways to mitigate that risk if you suspect an asymmetry is meaningful. Whether statistically meaningful or meaningful by way of concussion, prior injury, or other current or previous reason a drastic change may occur.
However, when I have an athlete in front of me that I am tasked with improving, and on the first day I give them a standardized dynamic warmup, that is truly the only time that the athlete is coming in with no intervention. GOOD TRAINING IS THE INTERVENTION! Interning at the University of Minnesota had a large influence on my training philosophy surrounding asymmetries because we could test the athletes during the workouts using the 1080. There were things built into the program we ran to mitigate the incidence of asymmetries. Some of the main ones like anterior posterior pattern cycling, using a cross-crawl pattern during an exercise, strengthening the foot and ankle every single lift, and other cool concepts definitely play a role in the longitudinal data you’ll see further down.
One of the stipulations I had in getting hired by IHT Human Performance in the beginning of 2025, was to purchase a 1080 Sprint. It is objectively one of the most informative testing and training tools on the market. The first thing we did was travel to different high schools and colleges to test their athletes. We ran single rep sprints at 20m with 2 kg on the 1080 Sprint 2. These observational studies had in total a little more than 100 athletes, with a mix of college football players, and high school football, baseball, basketball, and track athletes. We then looked at the same 12 steps (6 on the left, and 6 on the right), excluding the first few steps and the last few steps. Looking at this same segment of the sprint on all of the athletes tested, there was a 14% average force asymmetry between one limb and the other among everyone tested.
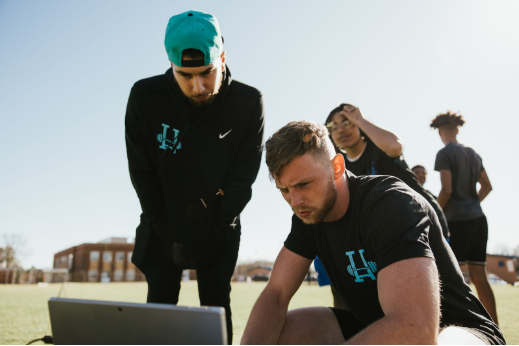
“IHT Owner Jared Slater and Coach Zach Jungels observing 1080 Sprint 2 data on high school football athletes.”
Then, with several schools and organizations, we attempted to test different interventions. At the beginning of the article, I mentioned that one of my favorite activities in Mariucci with the Triphasic Team was sitting behind the 1080 Sprint on the computer looking at graphs of our athletes as they would perform resisted sprinting. When I observed a large asymmetry, I would call on coaches Cal, Sam Lee, or Trevor Foreman to take a look at it and tell me what they thought.
The interventions were pretty straight forward. The first option was to use Reflexive Performance Reset, a system that uses muscle testing to find neurological muscle firing patterns and uses tactile feedback on neurolymphatic acupressure points to clear up those patterns and turn certain muscles back online. It was adapted from a system called Be Activated by Douglas Heel, has similar roots to Touch For Health, and other neurolymphatic acupressure systems. There were several muscle tests and reset spots used to find and fix asymmetries with RPR, most commonly the Glute Medius and TFL test along with some other muscle tests and spots. If these failed and their corresponding resets were used, most of the time the asymmetry would go away. Getting feet and hips adjusted by a chiropractor can also make a difference.
How about if you have a large group and aren’t able to do testing on every single one of your athletes?
The level 1 RPR warmup seems to be fairly effective in cleaning up asymmetries (no muscle testing) in single session interventions and seems to be even more effective when used long term in our training with IHT athletes. We did a single session single 2 rep intervention after a standardized dynamic warmup. Basically, we did a dynamic warmup, then tested the athletes, if they had an asymmetry, we did level 1 RPR then retested the sprint. With some of the athletes, it worked like a charm. But with some, it didn’t change at all or even made it slightly worse. Here are some of the changes we made using level 1 of RPR. After talking with coach Cal Dietz about this phenomenon, he speculated that it sometimes may take RPR a few sessions to fix. Meaning that it could take weeks. He also speculated that the addition of the infinity walks/goat drill would allow new muscle firing patterns to be integrated a bit quicker.
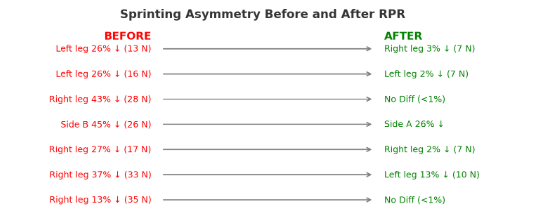
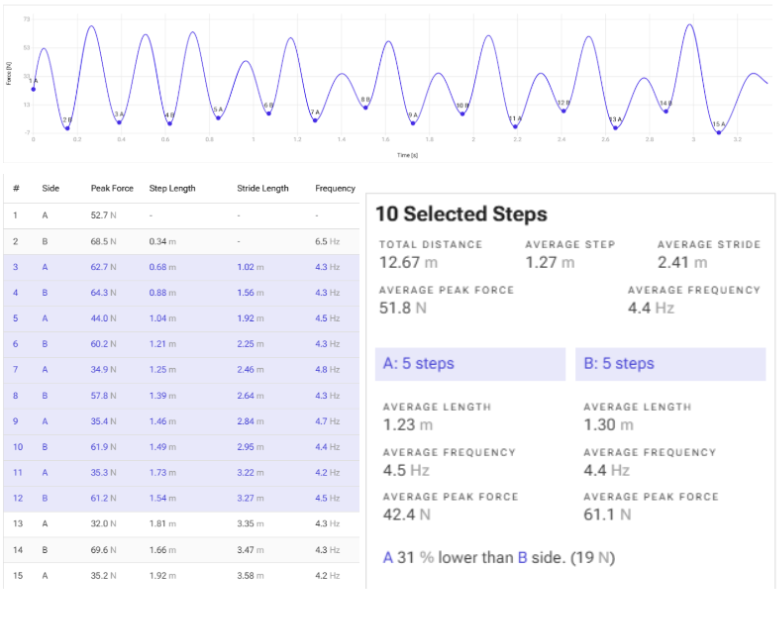
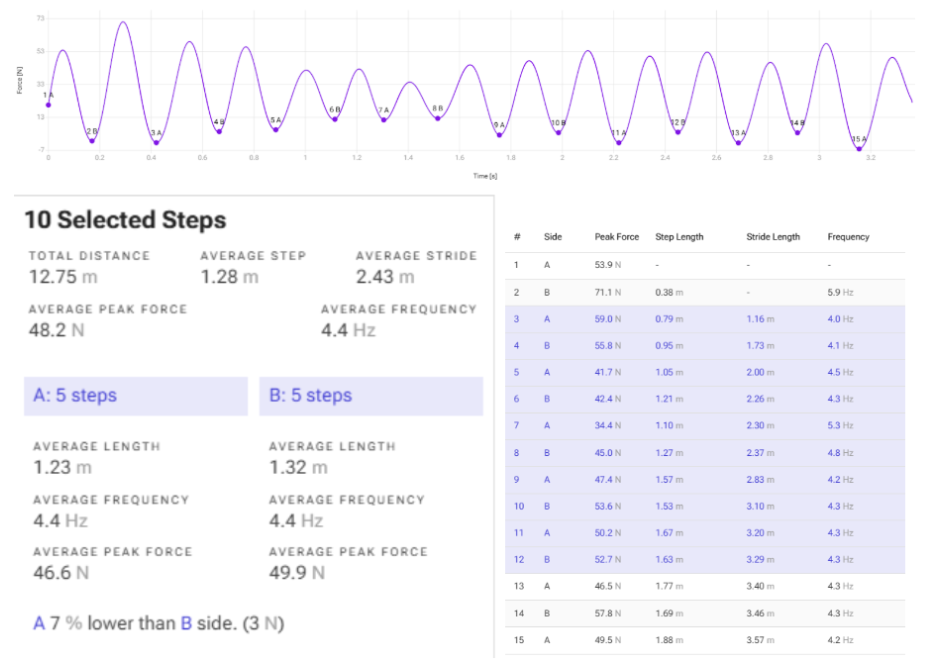
“Single session intervention observing the difference in asymmetries pre and post RPR Level 1 warmup in high school and collegiate athletic populations.” These are some cherry-picked examples from the single session/rep intervention groups for RPR level 1 collected by IHT Human Performance using the 1080 Sprint 2.
We also tried a Square1 only intervention. For those who are unfamiliar, Square1 is a neurological reset system that uses neuromuscular testing to find different head, eye, or joint positions that need more sensory motor input. Created by Shawn Sherman, this system helps the human body by filling sensory gaps that usually lead to improved performance outcomes. In this case, we chose 20 common “triggers” (a trigger is anything that would normally fail a neuromuscular test), and paired it with 1 general neuro “clear” (a clear in this case is the head/eye position that fixes the previously failed muscle test). The results for a single session intervention were very sporadic. Some athletes' asymmetries were completely corrected, some didn't change, and some of them got worse.
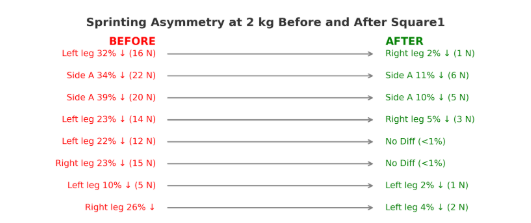
“Single session intervention observing the difference in asymmetries pre and post Square1 triggers and clears in high school and collegiate athletic populations.” These are some cherry picked examples from the single session/rep intervention groups for Square1 collected by IHT Human Performance using the 1080 Sprint 2.
Even though the 20 general triggers and clears idea didn’t seem to produce consistent results, on a case study basis, Square1 System has been very effective at clearing up force asymmetries. This is probably for a lot of reasons, including a not so good study design on my part. Before we opened the doors to IHT in late May, we were working out at a public gym called Crunch Fitness. We brought the 1080 into Crunch Fitness and ran 20-meter sprints down the turf. Many people did not like us very much when we did this. But many people were also interested in what the heck we were doing and volunteered to run. One of our friends that we met there named Curtis ran a series of 4 reps of 2 kg linear sprints at 20m and we observed a consistent +30% asymmetry between his left and right leg. All sprints had quite a pronounced asymmetry, this was rep 4/4.
“Observing a +30% asymmetry by Curtis on a 2kg linear sprint at 20m.”
I showed the graph to Jared who pulled Curtis off to the side and asked him a few questions. The first question was, “Are you dealing with any current pain/injury?” Curtis described a prior knee injury that he had recovered from but continued to give him issues in a single leg squat. He then ran through a quick 5 minutes of Square1 System targeting that particular issue and then we ran another sprint with the same conditions. As you can see in the graph below, looking at the exact same segment of the sprint, the force asymmetry went down from +30% to 7% on the 5th rep in a matter of minutes. Much lower than all of the previous reps. AND the pain in his knee went away. If anyone plans to pick up where I left off with this, I’m telling you that this would be a great place to start. Go after previous or current issues. Clean up a bunch of base patterns while you’re at it. I’m a firm believer that any tool you use that has a serious impact on the brain can make some quick observable and objective changes to someone's gait, posture, and interlimb force production. I’m showing you the latter with the data I present to you here while the former I am looking to show you in future articles.
“Asymmetry on rep 5/5 dropping from +30% to 7% after the use of Square1System.”
My next question was, “What if you used both?” We will answer that question shortly, but the proper answer is, they both seem to work, there’s no telling how long it will take to work, and we don’t know all of the factors in whether or not it will work to reduce an asymmetry.
In general, the greater the force asymmetry, the greater likelihood that you will notice some very pronounced gait asymmetries. The opposite can be true as well.. I’m fairly young, but I’ve coached a high number of athletes and to all my coaches out there, sometimes you can SEE when an athlete is compensating heavily. However, sometimes you can’t, and that is the beauty of the 1080. It can bring that data to you objectively. So when we see athletes with major force asymmetries, that can also be accompanied by longer/shorter stride lengths and higher/lower stride frequencies. In viewing this concept using the 1080, Matt Van Dyke, Executive Director of Sports Performance for the Houston Texans is the first person I heard talking about this at a 1080 conference. I saw a snippet of his presentation and he was saying that on a case study basis, a longer stride length and a lower stride frequency (longer ground contact time), led to a reduced average force output compared to the other limb that had a shorter stride length and a higher stride frequency, which led to a higher average force output. What I infer from this is that the brain is attempting to change the execution of the task to protect itself. If one side is lagging, the brain can learn to increase the output on the opposite side to keep the train rolling down the tracks.
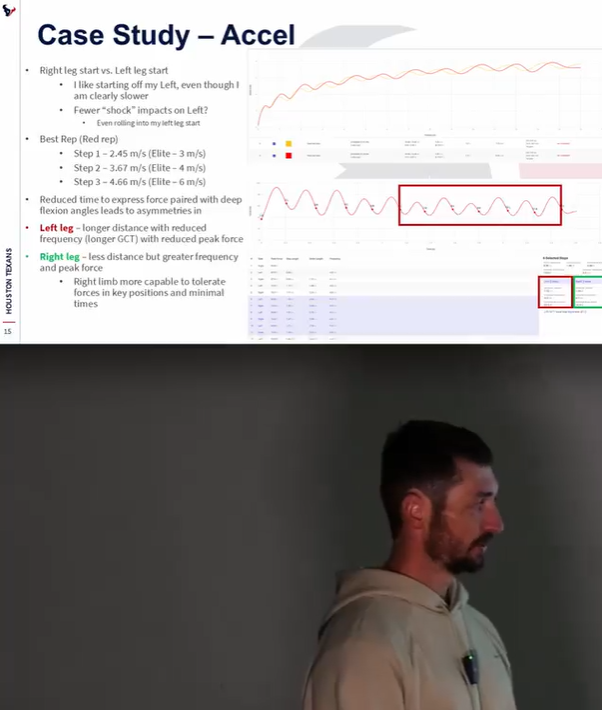
“Matt Van Dyke, Executive Director of Sports Performance for the Houston Texans, discussing a case study with data collected from the 1080 Sprint.” Here’s the link for anyone interested in watching the excerpt from the conference.
Even though I wasn’t there to see the whole presentation, I understand what Matt was saying, because I’ve viewed it many times on the 1080. Below is the BEST EXAMPLE of this exact case, plus the intervention that we used.
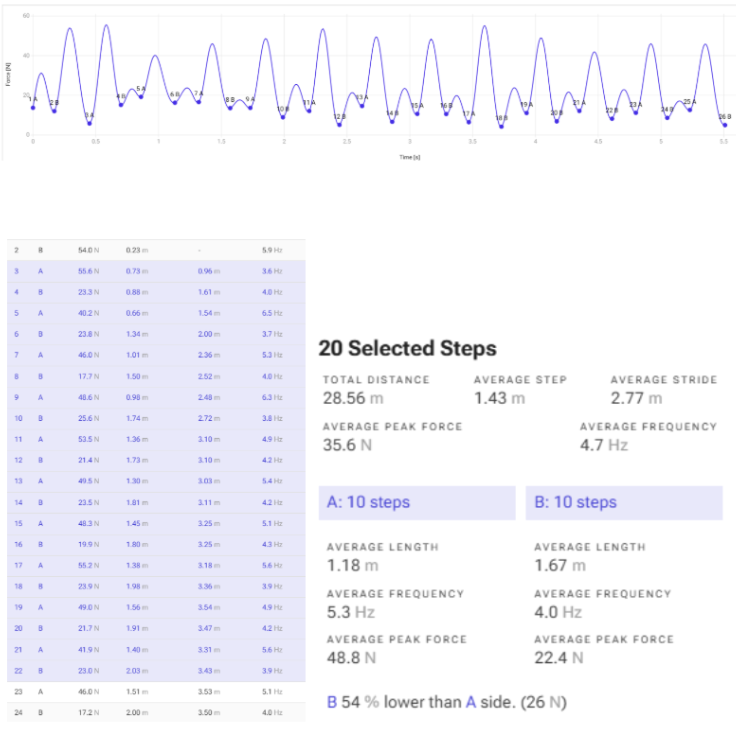
A high school football player demonstrates the largest force asymmetry I have seen to date. Excluding the first 2 and last 3 steps, this athlete had on average a 54% lower force production on side A versus side B. Shorter stride length, higher stride frequency, higher average force production on side A. Side B is complemented by a longer stride length, lower stride frequency, and lower peak force. This is the side that might’ve had a prior injury or otherwise is being compensated for.
Now for the most important part. We’ve observed it, which is cool, but what do we do about it? To answer the question from earlier, we applied the Square1 System and Reflexive Performance Reset. For the RPR side of the equation we applied the resets I discussed earlier plus a few others that I had learned at the University of Minnesota. Then, for the Square1 side of things we tested and cleared the 1080 belt, the stance, and the first step of the sprint as well as a few other things. The results that followed were quite shocking.
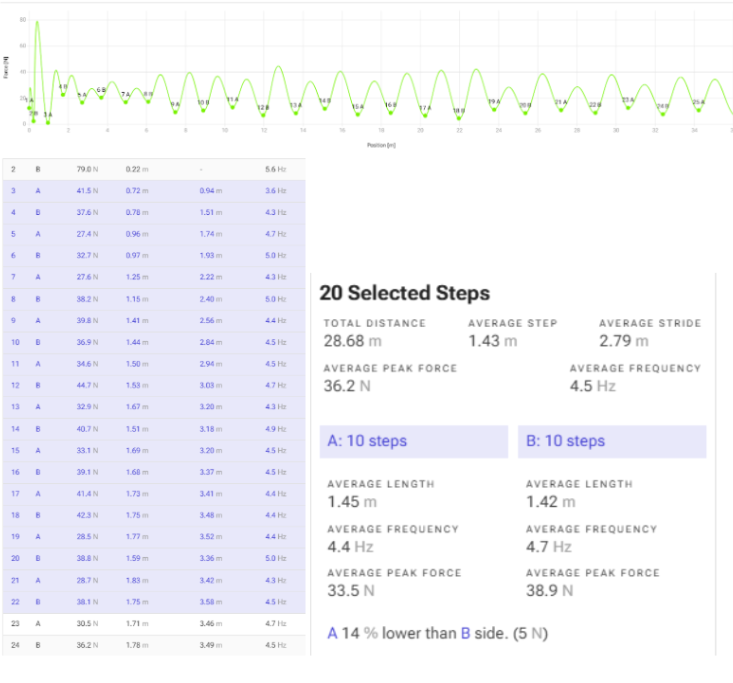
54% down to 14% force asymmetry. Goes from an extreme outlier into the average within a matter of minutes. How is this possible? When you understand that the brain is in command of everything surrounding gait and posture, you will begin to develop an answer to these kinds of questions. I’m personally not too concerned with what was responsible for this change, I just want to see the large asymmetry go down and stay down. Stride length and stride frequency average out as well and my only regret is not getting this individual's sprints on video. It was enough to convince me to keep looking at this and continue to test it. The only problem was that this was a single session intervention. Asymmetries and gait can change for the better or worse on a daily basis. We needed more longitudinal measurement.
What I decided to do was keep track of a large group of athletes and observe what our training program did to their force asymmetries. All of the athletes were on the same program, using the same loads, tested on the same days, over the same period of time. The data was collected in a similar manner as prior, excluding the first few and last few steps to observe the same amount of steps at the same phase of the sprint.
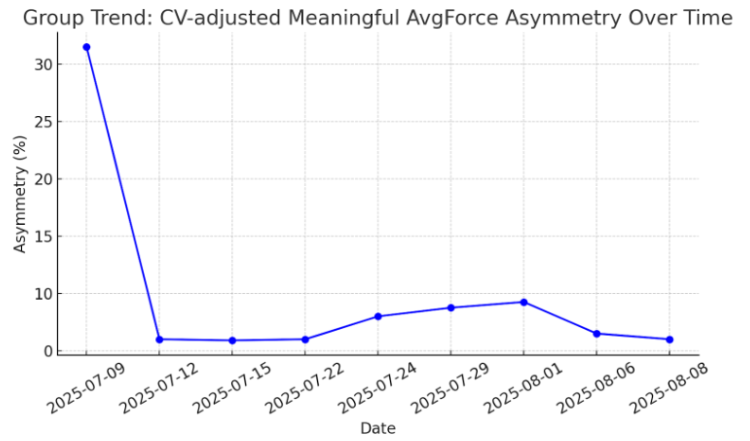
This graph answers the question: “During 1 month of training at IHT, what was the average meaningful percentage difference in average force between limbs, across 6 of 27 athletes in the group that had over a 20% (Statistically Meaningful) interlimb Force Asymmetry”
For every athlete in our first group, per testing day, we take all reps at the same test load and distance to calculate the average percent force asymmetry between the limbs. We also calculate each limb’s coefficient of variation (CV%), which represents the variability between reps. The CV% is calculated as:
CV%= (Standard Deviation/Mean) × 100
If the asymmetry % between limbs is greater than the average CV% of the two limbs, we label it as “meaningful asymmetry.” CV can be calculated in a group or an individual basis.
In the large dataset we collected earlier, on the single rep, single session basis (2kg at 20m), the average asymmetry across athletes was about 14% and that only included 1 rep. So, in this group of 27 athletes, we decided to look at the CV% adjusted differences. The group average CV% was 20% across 3 reps. On day one, 6 athletes were above that 20% threshold and were flagged as meaningful, with asymmetries averaging 32.8%. This number was 6 athletes and their CV adjusted force asymmetries: (26 + 34 + 46 + 31 + 38 + 22) / 6 = 32.8%
Following 1 month of our training program, those asymmetries quickly dropped below 10% within a few sessions and were maintained there through the summer. Meanwhile, athletes whose asymmetries started between 14–20% (not technically “meaningful” by the group threshold) still showed reductions as a whole, which likely had just as much impact on performance. Across the entire group, we also saw an average max velocity increase of 5%, alongside even greater improvements in the force plate data.
That said, it’s important to clarify how CV should ideally be applied. While using a group-average CV% (like 20%) provides a simple cutoff for cohort-level reporting, CV is best calculated within each athlete and per limb. Individual and limb-specific variability can differ quite a bit, so averaging across a whole group risks oversimplifying. A more precise approach would be to establish each athlete’s own CV% and then define meaningful asymmetry relative to their personal variability. In other words, asymmetry should be flagged only when the left-right difference exceeds the natural noise of that specific athlete’s limbs and not just when it clears a group average. But the problem with that is we weren’t able to observe consistent asymmetries across individuals within this group due to the quick change from our neural and training interventions.
So why emphasize CV at all?
Dr. Marc Lewis, Director of Applied Sports Science for the Houston Texans, explained in an interview with Justin Lima of the Strength Coach Network: “Depending on the sport/position group, there’s going to be different population-specific asymmetries that are there and are not necessarily a bad thing.” He went on to stress that we need to establish not only interlimb asymmetry but also the coefficient of variation for each limb. Without factoring in CV, we risk mistaking normal variability for “imbalance.”
In summary, the group CV% (20%) gave us a clean way to track cohort-level change and show that training reduced flagged asymmetries below 10% in the 6 people who had statistically meaningful asymmetries. I did this for all my sports science nerds out there, and if I messed anything up, please feel free to let me know.
As a performance coach, every group and every athlete is a case study. In this case, we ran a quick 10 week cycle of Triphasic training, using RPR + infinity walks/goat drill every single day to warm up. Square1 was used in instances of pain and injury, and also used in a general fashion as another safety measure.
What about in-season athletes?
The first group of 27 athletes trained 4 times a week in their offseason, but what about 2 teams of 37 athletes training 3 times a week in season? Would the results be similar? Turns out they would be, but with some interesting observations. The difference between the two groups is huge. The first group I showed you played baseball and were in the offseason and the second 2 groups we observed play junior college hockey and were IN SEASON.
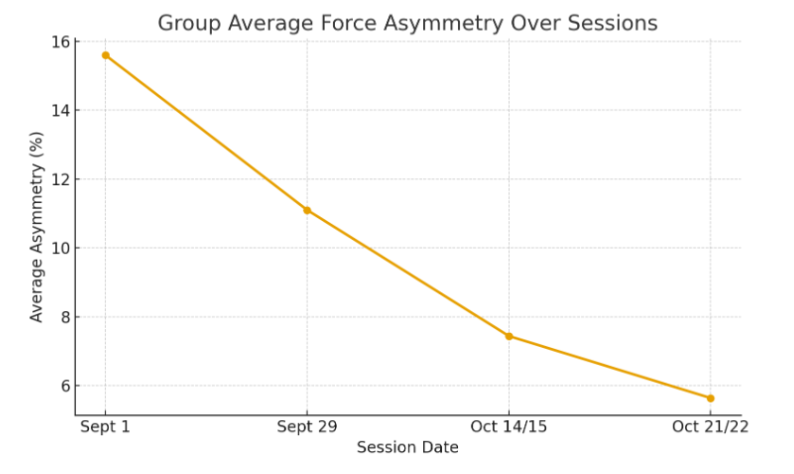
“Force Asymmetry % between L and R at 2 kg for 30 meters among all 37 athletes in our 2 junior hockey groups. It is important to note the major differences between this group of athletes and the last group of athletes is that this group includes ALL athletes from the group (NOT CV% ADJUSTED).”
8 steps on each leg were taken from the 1080 Sprint 2. We tried to take the same 8 steps from every athlete by excluding the first 2-4 steps and last 2-4 steps. This was because different athletes have different stride length and frequency values and we didn’t include the first or last few steps to try and keep it as similar as possible. We tested initially, a month into our training, and twice more 2 weeks apart. Data was collected in the same manner as the other groups and the same thing can be observed. As a group, the asymmetries started around or above our collected “average” and fell well below that after our training and neurological interventions. This group had 37 athletes and we have less data points on them then our other group, and we are also not choosing to display the CV% adjusted asymmetry due to lack of reps. They were trained in almost the exact same way, Triphasic Training, RPR, and Square1.
We made some REALLY interesting observations with this group. The group average was consistent with almost all other groups we’ve tested and the downward trend over time was noted in most individuals with significant asymmetries above 20% as noted by the average reduction. Some individuals experienced a normal fluctuation from rep to rep and day to day.
The most interesting observation was made in the athletes that sustained concussions. There were 3 instances where one of our athletes got a concussion and as soon as they were cleared, we would test them again and they had a massive asymmetry. The first athlete, who initially had an 18% difference between the left and right leg, had a 50% asymmetry after sustaining a concussion. After using Square1, RPR, and blind spot testing + OPK strips, we were able to reduce the asymmetry to 8% during the second session back and 4% after the 3rd session back. Another athlete initially tested with a 14% difference between the left and right side in linear sprinting. A week later they sustained a concussion in the same weekend as the previous athlete. They had a 38% asymmetry after returning to workouts. During the next testing sessions after applying our intervention, it reduced to 8%. Yet another athlete initially had a 15% asymmetry, it reduced to 3% after training with us for a few weeks, but after a concussion, it went all the way up to 29%. After being cleared and applying our interventions, the asymmetry went back down to 3%. I’m speculating that a few % asymmetry variation is normal, and that is why CV% adjusting your numbers and collecting them the same way every time is important. However, the fact that in almost every concussion case the asymmetries shot up by THAT MUCH does not seem like a coincidence or random variation to me.
We did have one athlete that had a concussion and another who was returning from a broken ankle and they did not have an asymmetry above 10%. I include this to say I think the human body is extremely complex. We cannot definitively say either way that asymmetries cause injury or injuries cause asymmetry.
But I do believe the following after presenting these findings. We are able to use neurological based interventions that make objective changes to asymmetries very quickly. If you are concerned with asymmetry, we can improve it drastically using many different methods, systems, and frameworks. These same systems I’m telling you about do wonders in helping with pain and injury, and that will be talked about thoroughly in future articles.
What are some key takeaways?
There is nothing to say that zero percent asymmetry is better than 10%. There is going to be a natural difference between limbs. If the sprinter with the best 100m dash time ever has a 13% force asymmetry, that should tell you it isn’t always harmful. In my mind, there is no threshold to look at because it is population specific and specific to the individuals you are testing. However, I am going to postulate that any force asymmetry in linear sprinting around or below 14% might be considered average based on the data I’ve collected and the populations I’ve worked with, and anything over 20% consistently might be considered atypical among the high school/college population we’ve tested..
Asymmetries in linear sprinting are different than they are in COD, jumping, and isometric/isokinetic force testing. Within linear sprinting the same athletes sprinting at different loads and distances will change the amount of force asymmetry present, and on any given day there will likely be some variance. So many little things go into this and so many unknowns, and that is why it is important to keep test conditions similar. What time of day/day of the week are you testing, are you testing within the same spot in the workout, what did you do in the previous session/what did the athlete do before they came to see you that day or week, is this athlete dealing with a previous issue. There are many questions you could probably ask here. Let’s all try and help each other out by asking questions, applying interventions, tracking those results, and sharing them with each other.
In my opinion based on the data I’ve collected, targeted neurological interventions reduce force and gait asymmetries both on a case study and a large group basis. Many other things, including intelligent programming, can work to reduce large asymmetries. There are many concepts within the Triphasic Training framework that help with this and there are other systems and individuals that I will speak about in the future that have a great idea of how to quell major compensations in the body. There are also MANY MORE brain balancing systems/devices/protocols that are extremely effective in reducing asymmetries BESIDES the few I’ve mentioned.
This has many implications for REHAB PROFESSIONALS. If you want to make quick and reliable changes to athletes that have a history of injury or a current issue they are dealing with, then it might be a good idea to check out the systems I mentioned above.
So whether or not you have access to the technology to monitor and observe asymmetries, you should consider checking out some of the people or things I have mentioned, as they’ve tested and confirmed similar results. As a strength coach, this gives you confidence to apply these principles. As a rehab professional, this can help your athletes return to play faster. And as a sports scientist, it can help you to inform your training staff about possible interventions for the problems you are seeing in your athletes. If you can’t afford the 1080 or a similar device, that is ok. Technology is advancing at such a rate that your iphone will be able to do much of the same in terms of stride length, stride frequency, and using the SMU predictive equations, might be able to give coaches adjunct data in force asymmetry output.
Thank you so much for reading, and don’t hesitate to reach out with any questions or comments as any feedback from coaches, researchers, or practitioners is very much appreciated. I love talking with people about this stuff and it continues to fuel the fire that I have to ask better questions and find the answers.
I want to thank Cal Dietz, Sam Lee, Trevor Foreman, Pat Robles, Jared Slater, Alex Larson, Andrew Peine, and Regan Quaal for helping collect data and allowing me the opportunity to test our hypothesis and present on the data.